view_context: Dynamic page
Statistics
Students get their first experience of statistics in this unit, defining a statistical question and investigating the key concepts of measures of center and measures of variability.
Math
Unit 8
6th Grade
Unit Summary
In Unit 8, 6th grade students get their first experience of statistics. Students come into 6th grade with some prior knowledge around data representations, such as bar graphs and line plots; however, this is the first time that students ask the question “what is statistics” and “what can it help me solve?” Students begin the unit by first determining what a statistical question is. Then they ask how they can interpret the data that comes from these questions (MP.2). Students learn various ways to represent the data, including frequency tables, histograms, dot plots, box plots, and circle graphs, and they analyze each representation to determine what information and conclusions they can glean from each one (MP.4).
Students will investigate two key concepts that will be important for future studies: measures of center and measures of variability. They’ll look at measures of center to investigate what a “typical” or average response to a question might be; they’ll look at measures of variation to understand how similar or different the data in the set may be or how reliable a measure of center might be. Students investigate all of this within context in order to better understand how statistics can be used to investigate questions and understand more about our world.
In 7th grade, students will continue their study of statistics and investigate multiple data distributions simultaneously. They will also deepen their understanding of sampling and how to use random sampling to draw inferences about populations.
Note: In December 2022, this unit was revised slightly to align more closely to the Common Core State Standards for Mathematics (CCSSM). The revision involved shifting when the concept of mean absolute deviation (MAD) was introduced from 7th grade to 6th grade. As a result, this unit now includes a new lesson (Lesson 10) where students understand MAD as a measure of variability of a data set. Students continue their work with measures of variability, including MAD, in 7th Grade Math: Unit 7.
Pacing: 16 instructional days (14 lessons, 1 flex day, 1 assessment day)
Fishtank Plus for Math
Unlock features to optimize your prep time, plan engaging lessons, and monitor student progress.
Assessment
The following assessments accompany Unit 8.
Pre-Unit
Have students complete the Pre-Unit Assessment and Pre-Unit Student Self-Assessment before starting the unit. Use the Pre-Unit Assessment Analysis Guide to identify gaps in foundational understanding and map out a plan for learning acceleration throughout the unit.
Mid-Unit
Have students complete the Mid-Unit Assessment after Lesson 7.
Post-Unit
Use the resources below to assess student understanding of the unit content and action plan for future units.
Use student data to drive instruction with an expanded suite of assessments. Unlock Pre-Unit and Mid-Unit Assessments, and detailed Assessment Analysis Guides to help assess foundational skills, progress with unit content, and help inform your planning.
Unit Prep
Intellectual Prep
Internalization of Standards via the Post-Unit Assessment
- Take the Post-Unit Assessment. Annotate for:
- Standards that each question aligns to
- Strategies and representations used in daily lessons
- Relationship to Essential Understandings of unit
- Lesson(s) that Assessment points to
Internalization of Trajectory of Unit
- Read and annotate the Unit Summary.
- Notice the progression of concepts through the unit using the Lesson Map.
- Do all Target Tasks. Annotate the Target Tasks for:
- Essential Understandings
- Connection to Post-Unit Assessment questions
- Identify key opportunities to engage students in academic discourse. Read through our Teacher Tool on Academic Discourse and refer back to it throughout the unit.
Unit-Specific Intellectual Prep
- Read the Progressions for the Common Core State Standards in Mathematics, 6-8 Statistics and Probability for standards relevant to this unit.
- Read the following table that includes models use throughout the unit.
| Model | Example |
| tally chart | 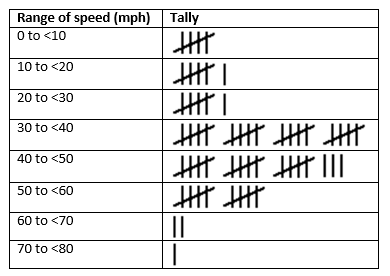 |
| frequency table
|
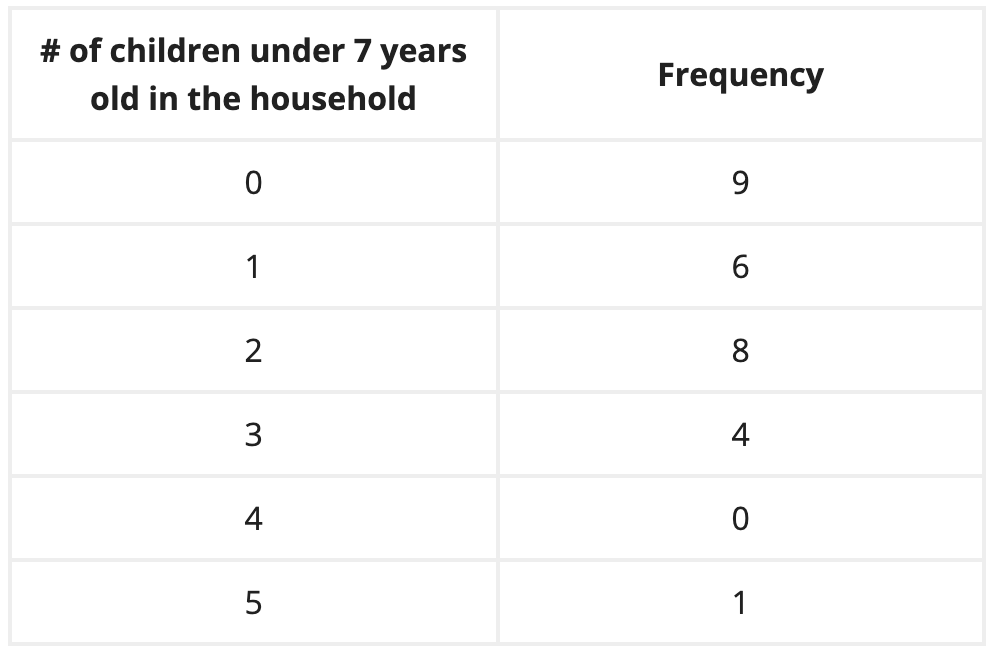 |
| dot plot | 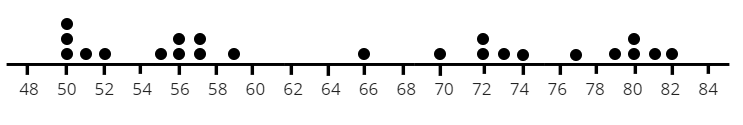 |
| histogram | 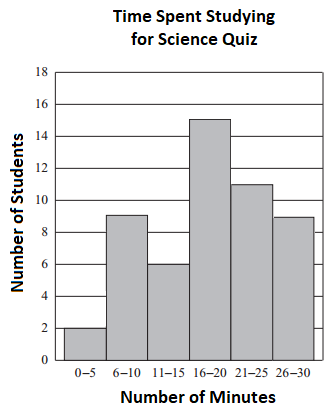 |
| box plot | 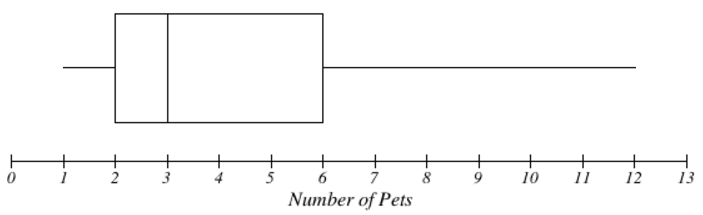 |
| circle graph | 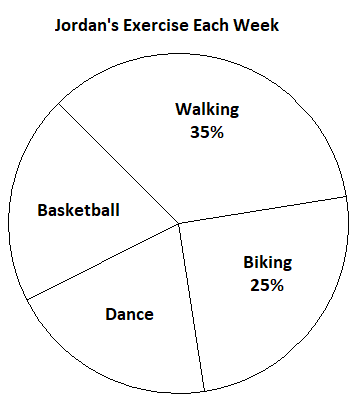 |
Essential Understandings
- Statistics is a powerful tool to seek answers to statistical questions and to understand data distributions and what inferences can be drawn about the data.
- Graphical representations of data, including dot plots, histograms, box plots, and circle graphs, are useful to organize data and highlight information about the overall shape of the data set.
- Measures of center, including the mean, median, and mode, provide information about the center of data sets. Depending on the shape and distribution of a data set, one measure may better represent a data set than others; however, with explanation, there may be a valid reason to choose any of the measures of center.
- Measures of variation or spread, including the range, interquartile range, and mean absolute deviation, provide information about the spread, variation, or consistency of a data set.
- When making decisions about data, it is valuable to consider both measures of center and measures of variation.
Vocabulary
Unit Vocabulary
box plot
categorical data
circle graph
cluster
distribution
dot plot
five-number summary
frequency table
histogram
interquartile range
lower quartile
median
measure of center
mean (average)
mean absolute deviation (MAD)
mode
numerical data
outlier
range
skewed left/right
statistical question
symmetrical
upper quartile
To see all the vocabulary for Unit 8, view our 6th Grade Vocabulary Glossary.
Materials
- Calculators (1 per student)
- Optional: Play money (1 set per small group)
- Number strips (1 per student) — These require some cutting, which can either be done prior to the lesson or during the lesson if scissors are provided to the students. Note, the same strips are used for both Lesson 6 and Lesson 9.
- Standard deck of playing cards (1 per small group)
To see all the materials needed for this course, view our 6th Grade Course Material Overview.
Lesson Map
Topic A: Understanding Statistics & Distributions
Topic B: Measurements of Center & Variability
Topic C: Box Plots & Circle Graphs
Common Core Standards
Key
Major Cluster
Supporting Cluster
Additional Cluster
Core Standards
Statistics and Probability
-
6.SP.A.1 — Recognize a statistical question as one that anticipates variability in the data related to the question and accounts for it in the answers. For example, "How old am I?" is not a statistical question, but "How old are the students in my school?" is a statistical question because one anticipates variability in students' ages.
-
6.SP.A.2 — Understand that a set of data collected to answer a statistical question has a distribution which can be described by its center, spread, and overall shape.
-
6.SP.A.3 — Recognize that a measure of center for a numerical data set summarizes all of its values with a single number, while a measure of variation describes how its values vary with a single number.
-
6.SP.B.4 — Display numerical data in plots on a number line, including dot plots, histograms, and box plots.
-
6.SP.B.5 — Summarize numerical data sets in relation to their context, such as by:
-
6.SP.B.5.A — Reporting the number of observations.
-
6.SP.B.5.B — Describing the nature of the attribute under investigation, including how it was measured and its units of measurement.
-
6.SP.B.5.C — Giving quantitative measures of center (median and/or mean) and variability (interquartile range and/or mean absolute deviation), as well as describing any overall pattern and any striking deviations from the overall pattern with reference to the context in which the data were gathered.
-
6.SP.B.5.D — Relating the choice of measures of center and variability to the shape of the data distribution and the context in which the data were gathered.
Foundational Standards
Measurement and Data
-
4.MD.B.4
-
4.MD.C.5
-
5.MD.B.2
Ratios and Proportional Relationships
-
6.RP.A.3
-
6.RP.A.3.C
The Number System
-
6.NS.B.2
-
6.NS.B.3
Future Standards
Interpreting Categorical and Quantitative Data
-
HSS-ID.A.1
-
HSS-ID.A.2
-
HSS-ID.A.3
-
HSS-ID.A.4
Statistics and Probability
-
7.SP.A.1
-
7.SP.A.2
-
7.SP.B.3
-
7.SP.B.4
Standards for Mathematical Practice
-
CCSS.MATH.PRACTICE.MP1 — Make sense of problems and persevere in solving them.
-
CCSS.MATH.PRACTICE.MP2 — Reason abstractly and quantitatively.
-
CCSS.MATH.PRACTICE.MP3 — Construct viable arguments and critique the reasoning of others.
-
CCSS.MATH.PRACTICE.MP4 — Model with mathematics.
-
CCSS.MATH.PRACTICE.MP5 — Use appropriate tools strategically.
-
CCSS.MATH.PRACTICE.MP6 — Attend to precision.
-
CCSS.MATH.PRACTICE.MP7 — Look for and make use of structure.
-
CCSS.MATH.PRACTICE.MP8 — Look for and express regularity in repeated reasoning.
