view_context: Dynamic page
Probability
Students have their first encounter with probability, as they develop their understanding of probability through calculating theoretical probabilities and designing and running their own simulations.
Math
Unit 8
7th Grade
Unit Summary
In Unit 8, 7th grade students finish the year with their first encounter with probability. They develop their understanding of probability through analyzing experiments, calculating theoretical probabilities, and designing and running their own simulations to model real-world situations MP.4 Model with mathematics. . A central focus of the unit is understanding probability as a description of long-run behavior, grounded in repeated chance processes and relative frequency rather than single outcomes or guesses. Students encounter and use a variety of tools including spinners, dice, cards, coins, etc., and organizational tools such as organized lists, tables, and tree diagrams when they study compound probability MP.5 Use appropriate tools strategically. . Throughout the unit, students compare predicted probabilities from models to observed results and reason about why these may differ.
Students draw on and re-engage with concepts from ratios and proportions in order to fully understand probability as a ratio of desired outcomes to total outcomes. They also use proportional relationships to estimate long-run frequencies based on probabilities of experiments. Prior work with data, variability, and informal ideas of fairness and randomness supports students in interpreting experimental results and making sense of variation in small samples.
In High School, students will further explore probability, distinguishing between independent events and conditional events and developing rules to calculate probabilities of these compound events. This unit lays the conceptual groundwork for those ideas by emphasizing sample space, modeling assumptions, and the use of simulation to explore complex or uncertain situations.
Pacing: 11 instructional days (9 lessons, 1 flex day, 1 assessment day)
Fishtank Plus for Math
Unlock features to optimize your prep time, plan engaging lessons, and monitor student progress.
Assessment
The following assessments accompany Unit 8.
Pre-Unit
Have students complete the Pre-Unit Assessment and Pre-Unit Student Self-Assessment before starting the unit. Use the Pre-Unit Assessment Analysis Guide to identify gaps in foundational understanding and map out a plan for learning acceleration throughout the unit.
Mid-Unit
Have students complete the Mid-Unit Assessment.
Post-Unit
Use the resources below to assess student understanding of the unit content and action plan for future units.
Use student data to drive instruction with an expanded suite of assessments. Unlock Pre-Unit and Mid-Unit Assessments, and detailed Assessment Analysis Guides to help assess foundational skills, progress with unit content, and help inform your planning.
Unit Prep
Intellectual Prep
Internalization of Standards via the Post-Unit Assessment
- Take the Post-Unit Assessment. Annotate for:
- Standards that each question aligns to
- Strategies and representations used in daily lessons
- Relationship to Essential Understandings of unit
- Lesson(s) that Assessment points to
Internalization of Trajectory of Unit
- Read and annotate the Unit Summary.
- Notice the progression of concepts through the unit using the Lesson Map.
- Do all Target Tasks. Annotate the Target Tasks for:
- Essential Understandings
- Connection to Post-Unit Assessment questions
- Identify key opportunities to engage students in academic discourse. Read through our Teacher Tool on Academic Discourse and refer back to it throughout the unit.
Unit-Specific Intellectual Prep
- Read the Progressions for the Common Core State Standards in Mathematics, 6-8 Statistics and Probability for standards relevant to this unit.
- Read the following table that includes examples of models used in this unit.
| Model | Example |
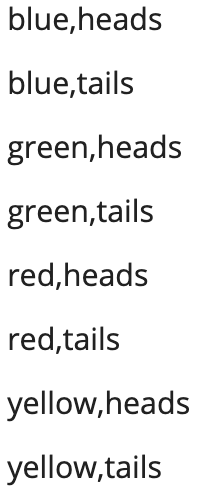
| organized list |
The sample space for a spinner with 4 equal sections labeled yellow, blue, green, and red, and a fair coin with sides heads and tails
|
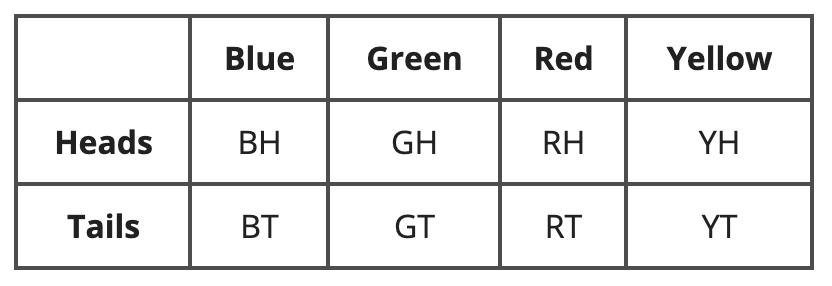
| table |
The sample space for a spinner with 4 equal sections labeled yellow, blue, green, and red, and a fair coin with sides heads and tails
|
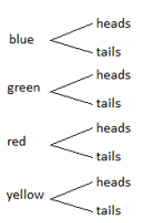
| tree diagram |
The sample space for a spinner with 4 equal sections labeled yellow, blue, green, and red, and a fair coin with sides heads and tails
|
Essential Understandings
- The probability of an event or combination of events occurring is determined by the number of desired or favorable outcomes divided by the total number of outcomes possible. This value ranges from 0, where the event is impossible, to 1, where the event is certain to occur, with various levels of likelihood in between.
- Probabilities can be estimated experimentally through repeated trials or determined theoretically by analyzing the structure of a chance process and its sample space.
- Experimental or theoretical probabilities can be used to estimate or predict long run relative frequencies, though results from small samples may vary due to randomness.
- Real-world situations involving uncertainty can be modeled and explored using simulations to test hypotheses, make predictions, and evaluate how well a model fits observed data.
Materials
- Dice (2 per student)
- Counters (11 per small group)
- Brown paper bag (2 per pair of students)
- Cubes (1 set per small group) (15 with 5 red and 10 of different colors)
- Plastic cups (non-see-through) (3 per small group)
- Plastic balls (like ping-pong) (1 per small group)
- Coins (1 per student)
- Optional: Standard deck of playing cards (1 per small group)
- Optional: Spinners
-
The Car Race Game (1 per small group)
-
Predictions and Results Sheet (1 per small group)
Vocabulary and Models
Unit Vocabulary
compound event
experimental probability
likelihood
outcome
probability
sample space
simulation
simple event
theoretical probability
To see all the vocabulary for Unit 8, view our 7th Grade Vocabulary Glossary.
Lesson Map
Topic A: Probability Models of Simple Events
Topic B: Probability Models of Compound Events
Common Core Standards
Key
Major Cluster
Supporting Cluster
Additional Cluster
Core Standards
Statistics and Probability
-
7.SP.C.5 — Understand that the probability of a chance event is a number between 0 and 1 that expresses the likelihood of the event occurring. Larger numbers indicate greater likelihood. A probability near 0 indicates an unlikely event, a probability around 1/2 indicates an event that is neither unlikely nor likely, and a probability near 1 indicates a likely event.
-
7.SP.C.6 — Approximate the probability of a chance event by collecting data on the chance process that produces it and observing its long-run relative frequency, and predict the approximate relative frequency given the probability. For example, when rolling a number cube 600 times, predict that a 3 or 6 would be rolled roughly 200 times, but probably not exactly 200 times.
-
7.SP.C.7 — Develop a probability model and use it to find probabilities of events. Compare probabilities from a model to observed frequencies; if the agreement is not good, explain possible sources of the discrepancy.
-
7.SP.C.7.A — Develop a uniform probability model by assigning equal probability to all outcomes, and use the model to determine probabilities of events. For example, if a student is selected at random from a class, find the probability that Jane will be selected and the probability that a girl will be selected.
-
7.SP.C.7.B — Develop a probability model (which may not be uniform) by observing frequencies in data generated from a chance process. For example, find the approximate probability that a spinning penny will land heads up or that a tossed paper cup will land open-end down. Do the outcomes for the spinning penny appear to be equally likely based on the observed frequencies?
-
7.SP.C.8 — Find probabilities of compound events using organized lists, tables, tree diagrams, and simulation.
-
7.SP.C.8.A — Understand that, just as with simple events, the probability of a compound event is the fraction of outcomes in the sample space for which the compound event occurs.
-
7.SP.C.8.B — Represent sample spaces for compound events using methods such as organized lists, tables and tree diagrams. For an event described in everyday language (e.g., "rolling double sixes"), identify the outcomes in the sample space which compose the event.
-
7.SP.C.8.C — Design and use a simulation to generate frequencies for compound events. For example, use random digits as a simulation tool to approximate the answer to the question: If 40% of donors have type A blood, what is the probability that it will take at least 4 donors to find one with type A blood?
Foundational Standards
Number and Operations—Fractions
-
5.NF.A.2
Ratios and Proportional Relationships
-
7.RP.A.2
-
7.RP.A.3
Statistics and Probability
-
7.SP.A.1
Future Standards
Conditional Probability and the Rules of Probability
-
HSS-CP.A.1
-
HSS-CP.A.2
-
HSS-CP.A.3
-
HSS-CP.A.4
-
HSS-CP.A.5
-
HSS-CP.B.6
-
HSS-CP.B.7
-
HSS-CP.B.8
-
HSS-CP.B.9
Statistics and Probability
-
8.SP.A.4
Using Probability to Make Decisions
-
HSS-MD.A.3
-
HSS-MD.A.4
Standards for Mathematical Practice
-
CCSS.MATH.PRACTICE.MP1 — Make sense of problems and persevere in solving them.
-
CCSS.MATH.PRACTICE.MP2 — Reason abstractly and quantitatively.
-
CCSS.MATH.PRACTICE.MP3 — Construct viable arguments and critique the reasoning of others.
-
CCSS.MATH.PRACTICE.MP4 — Model with mathematics.
-
CCSS.MATH.PRACTICE.MP5 — Use appropriate tools strategically.
-
CCSS.MATH.PRACTICE.MP6 — Attend to precision.
-
CCSS.MATH.PRACTICE.MP7 — Look for and make use of structure.
-
CCSS.MATH.PRACTICE.MP8 — Look for and express regularity in repeated reasoning.
