view_context: Dynamic page
Proportional Relationships
Students deepen their understanding of ratios to investigate proportional relationships, in order to solve multi-step, real-world ratio problems using new strategies that rely on proportional reasoning.
Math
Unit 1
7th Grade
Unit Summary
Please Note: In March 2025, this unit and its lesson plans received a round of enhancements. Teachers should pay close attention as they intellectually prepare to account for the updated pacing and content.
In Unit 1, 7th grade students deepen their understanding of ratios to investigate and analyze proportional relationships. They begin the unit by looking at how proportional relationships are represented in tables, equations, and graphs. As they analyze each representation, students continue to internalize what proportionality means, and how concepts like the constant of proportionality are visible in different ways. Students then spend time comparing examples of proportional and nonproportional associations, and studying how all the representations are connected to one another. Finally, in this unit, students will solve multi-step, real-world ratio and rate problems using efficient strategies and representations that rely on proportional reasoning MP.4 Model with mathematics. . These new strategies and representations, such as setting up and solving a proportion, are added to students' growing list of approaches to solve problems. Throughout the unit, students will translate between equations, graphs, tables, and written explanations, reasoning both abstractly and quantitatively MP.2 Reason abstractly and quantitatively. . They compute and communicate with precision, paying careful attention to their units and calculations MP.6 Attend to precision. .
In 6th grade, students were introduced to the concept of ratios and rates. They learned several strategies to represent ratios and to solve problems, including using concrete drawings, double number lines, tables, tape diagrams, and graphs. They defined and found unit rates and applied these to measurement conversion problems. 7th grade students will draw on these understandings to fully make sense of and solve problems involving proportional relationships.
Beyond this unit, in Unit 5, students will reengage with proportional reasoning as they solve percent problems and investigate how proportional reasoning applies to scale drawings. In 8th grade, students connect unit rate and constants of proportionality to slope, and they compare proportional relationships across different representations. They expand their understanding of nonproportional relationships to study linear functions in the form of $$y=mx+b$$, and compare these to nonlinear functions, such as $$y=6x^2$$.
Pacing: 22 instructional days (18 lessons, 3 flex days, 1 assessment day)
Fishtank Plus for Math
Unlock features to optimize your prep time, plan engaging lessons, and monitor student progress.
Assessment
The following assessments accompany Unit 1.
Pre-Unit
Have students complete the Pre-Unit Assessment and Pre-Unit Student Self-Assessment before starting the unit. Use the Pre-Unit Assessment Analysis Guide to identify gaps in foundational understanding and map out a plan for learning acceleration throughout the unit.
Mid-Unit
Have students complete the Mid-Unit Assessment after Lesson 9.
Post-Unit
Use the resources below to assess student understanding of the unit content and action plan for future units.
Use student data to drive instruction with an expanded suite of assessments. Unlock Pre-Unit and Mid-Unit Assessments, and detailed Assessment Analysis Guides to help assess foundational skills, progress with unit content, and help inform your planning.
Unit Prep
Intellectual Prep
Before you teach this unit, unpack the standards, big ideas, and connections to prior and future content through our guided intellectual preparation process. Each Unit Launch includes a series of short videos, targeted readings, and opportunities for action planning to ensure you're prepared to support every student.
Internalization of Standards via the Post-Unit Assessment
- Take the Post-Unit Assessment. Annotate for:
- Standards that each question aligns to
- Strategies and representations used in daily lessons
- Relationship to Essential Understandings of unit
- Lesson(s) that Assessment points to
Internalization of Trajectory of Unit
- Read and annotate the Unit Summary.
- Notice the progression of concepts through the unit using the Lesson Map.
- Do all Target Tasks. Annotate the Target Tasks for:
- Essential Understandings
- Connection to Post-Unit Assessment questions
- Identify key opportunities to engage students in academic discourse. Read through our Teacher Tool on Academic Discourse and refer back to it throughout the unit.
Unit-Specific Intellectual Prep
- Read Progressions for the Common Core State Standards in Mathematics, 6-7, Ratios and Proportional Relationships to gain a better understanding of what students have learned in sixth grade and what is expected in seventh grade.
- The UnboundEd Ratios: Unbound: A Guide to Grade 7 Mathematics Standards is also a great read.
Essential Understandings
- A proportional relationship between two quantities is a collection of equivalent ratios, related to each other by a constant of proportionality.
- Proportional relationships can be represented in different, related ways, including a table, equation, graph, and written description. Knowing one representation provides the information needed to represent the relationship in a different way.
- A unit rate, associated with a ratio $$a:b$$, is $$a/b$$ or $$b/a$$ units of one quantity per 1 unit of another quantity. Unit rates are represented in equations of the form $${y=kx}$$ and in graphs of proportional relationships as the ordered pair $$(1, r)$$.
- There are many applications that can be solved using proportional reasoning, including problems with price increases and decreases, commissions, fees, unit prices, and constant speed.
Materials
- Calculators (1 per student)
- Graph Paper (2-3 sheets per student)
- Ruler (1 per student)
- Optional: Poster paper (1 per small group)
- Optional: Markers (1 set of markers per small group)
- Optional: Resource: Ms. Baca's Green Paint Ratios (G7U1 L4 AP2 Alternative Version) (1 set of cards)
To see all the materials needed for this course, view our 7th Grade Course Material Overview.
Vocabulary and Models
Unit Vocabulary
constant of proportionality
commission
proportional
proportion
proportional relationship
Foundational Vocabulary
dependent variable
equivalent ratio
independent variable
part to whole ratio
part to part ratio
rate
ratio
unit rate
To see all the vocabulary for Unit 1, view our 7th Grade Vocabulary Glossary.
Access foundational vocabulary for Unit 1 in the same 7th Grade Vocabulary Glossary.
Models
| Model | Example | ||||||||||
| setting up and solving a proportion | A group of 4 students buy movie tickets for $24. At this rate, how much would 20 students pay for the movie? $$\frac{4\space \mathrm{students}}{$24} = \frac{20\space \mathrm{students}}{$x}$$ $$4x=24(20)$$ $$x=$120$$ |
||||||||||
| table of equivalent ratios | The table below shows some weights of rice, in pounds, and their corresponding costs, in dollars.
|
||||||||||
| equation | The equation $$y=8.75x$$ represents the cost in dollars, $$y$$, to purchase $$x$$ pounds of turkey meat at a deli. |
||||||||||
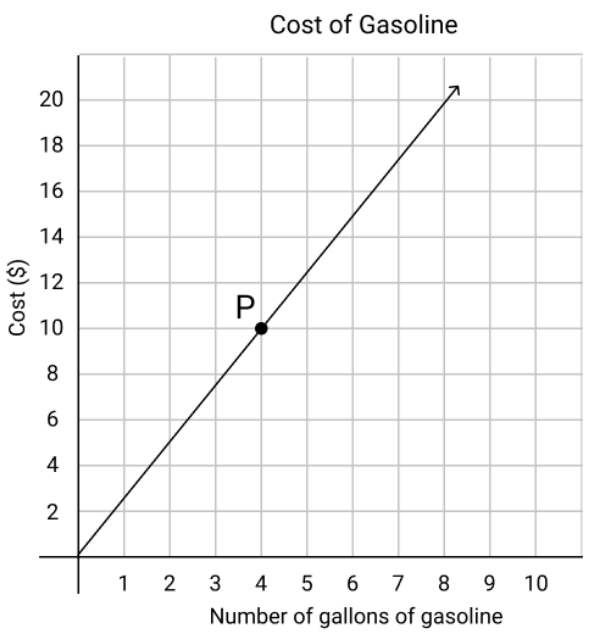
| graph | The graph below shows the relationship between the cost of gas and the number of gallons of gas purchased at a gas station.
|
||||||||||
| tape diagram | The tape diagram below shows how much the original price of a phone case is if it is on sale for $$\frac{1}{3}$$ off, and the discounted price was $24.
|

Lesson Map
Topic A: Representing Proportional Relationships in Tables, Equations, and Graphs
Topic B: Nonproportional Relationships
Topic C: Connecting Everything Together
Topic D: Solving Ratio & Rate Problems with Fractions
Common Core Standards
Key
Major Cluster
Supporting Cluster
Additional Cluster
Core Standards
Ratios and Proportional Relationships
-
7.RP.A.1 — Compute unit rates associated with ratios of fractions, including ratios of lengths, areas and other quantities measured in like or different units. For example, if a person walks 1/2 mile in each 1/4 hour, compute the unit rate as the complex fraction (1/2)/(1/4) miles per hour, equivalently 2 miles per hour.
-
7.RP.A.2 — Recognize and represent proportional relationships between quantities.
-
7.RP.A.2.A — Decide whether two quantities are in a proportional relationship, e.g., by testing for equivalent ratios in a table or graphing on a coordinate plane and observing whether the graph is a straight line through the origin.
-
7.RP.A.2.B — Identify the constant of proportionality (unit rate) in tables, graphs, equations, diagrams, and verbal descriptions of proportional relationships.
-
7.RP.A.2.C — Represent proportional relationships by equations. For example, if total cost t is proportional to the number n of items purchased at a constant price p, the relationship between the total cost and the number of items can be expressed as t = pn.
-
7.RP.A.2.D — Explain what a point (x, y) on the graph of a proportional relationship means in terms of the situation, with special attention to the points (0, 0) and (1, r) where r is the unit rate.
-
7.RP.A.3 — Use proportional relationships to solve multistep ratio and percent problems. Examples: simple interest, tax, markups and markdowns, gratuities and commissions, fees, percent increase and decrease, percent error.
Foundational Standards
Expressions and Equations
-
6.EE.B.7
-
6.EE.C.9
Number and Operations—Fractions
-
5.NF.B.6
Ratios and Proportional Relationships
-
6.RP.A.1
-
6.RP.A.2
-
6.RP.A.3
-
6.RP.A.3.A
-
6.RP.A.3.B
The Number System
-
6.NS.A.1
Future Standards
Expressions and Equations
-
8.EE.B.5
-
8.EE.B.6
Functions
-
8.F.A.1
-
8.F.A.2
-
8.F.A.3
-
8.F.B.4
-
8.F.B.5
Standards for Mathematical Practice
-
CCSS.MATH.PRACTICE.MP1 — Make sense of problems and persevere in solving them.
-
CCSS.MATH.PRACTICE.MP2 — Reason abstractly and quantitatively.
-
CCSS.MATH.PRACTICE.MP3 — Construct viable arguments and critique the reasoning of others.
-
CCSS.MATH.PRACTICE.MP4 — Model with mathematics.
-
CCSS.MATH.PRACTICE.MP5 — Use appropriate tools strategically.
-
CCSS.MATH.PRACTICE.MP6 — Attend to precision.
-
CCSS.MATH.PRACTICE.MP7 — Look for and make use of structure.
-
CCSS.MATH.PRACTICE.MP8 — Look for and express regularity in repeated reasoning.
