view_context: Dynamic page
Bivariate Data
Students combine their knowledge of linear functions with knowledge of data representations and analysis to make the jump from univariate data in one variable to bivariate data in two variables.
Math
Unit 8
8th Grade
Unit Summary
In Unit 8, 8th Grade students extend their understanding of statistics from univariate data to bivariate data. They re-engage in the major work of the grade, analyzing scatterplots for positive, negative, linear, and nonlinear trends, drawing lines to represent relationships, writing and interpreting linear equations, and using those equations to make predictions beyond the scope of the data MP.7 Look for and make use of structure. MP.2 Reason abstractly and quantitatively. . Students also analyze categorical bivariate data using two-way tables, calculate relative frequencies, and determine whether there is evidence of an association between variables.
Throughout the unit, students examine data representations and ask whether patterns suggest an association and what that association means in context. They distinguish between association and causation and justify their conclusions using proportional reasoning and structure in the data. MP.3 Construct viable arguments and critique the reasoning of others.
Prior to 8th Grade, students explored how and why data is collected—by thinking about statistical questions, samples, populations, and various ways to analyze data representations. Students worked with line plots, histograms, and box plots, and they considered what the shape, center, and spread of these data sets said about the data itself.
In High School, students’ understanding of statistics is formalized. They analyze bivariate data using functions, design and carry out experiments, and make predictions about outcomes based on probabilities. Students use their knowledge of association between variables as a basis for correlation. They develop nonlinear models for data and formally analyze how closely the model fits the data.
Pacing: 12 instructional days (9 lessons, 5 project days, 2 flex days, 1 assessment day)
Fishtank Plus for Math
Unlock features to optimize your prep time, plan engaging lessons, and monitor student progress.
Assessment
The following assessments accompany Unit 8.
Pre-Unit
Have students complete the Pre-Unit Assessment and Pre-Unit Student Self-Assessment before starting the unit. Use the Pre-Unit Assessment Analysis Guide to identify gaps in foundational understanding and map out a plan for learning acceleration throughout the unit.
Mid-Unit
Have students complete the Mid-Unit Assessment after Lesson 5.
Post-Unit
Use the resources below to assess student understanding of the unit content and action plan for future units.
Use student data to drive instruction with an expanded suite of assessments. Unlock Pre-Unit and Mid-Unit Assessments, and detailed Assessment Analysis Guides to help assess foundational skills, progress with unit content, and help inform your planning.
Unit Prep
Intellectual Prep
Internalization of Standards via the Post-Unit Assessment
- Take the Post-Unit Assessment. Annotate for:
- Standards that each question aligns to
- Strategies and representations used in daily lessons
- Relationship to Essential Understandings of unit
- Lesson(s) that Assessment points to
Internalization of Trajectory of Unit
- Read and annotate the Unit Summary.
- Notice the progression of concepts through the unit using the Lesson Map.
- Do all Target Tasks. Annotate the Target Tasks for:
- Essential Understandings
- Connection to Post-Unit Assessment questions
- Identify key opportunities to engage students in academic discourse. Read through our Teacher Tool on Academic Discourse and refer back to it throughout the unit.
Unit-Specific Intellectual Prep
- Read the Progressions for the Common Core State Standards in Mathematics, 6-8 Statistics and Probability for standards relevant to this unit, starting on page 185.
- Read the table below that includes models used throughout the unit.
| Model | Example |
| scatter plot | 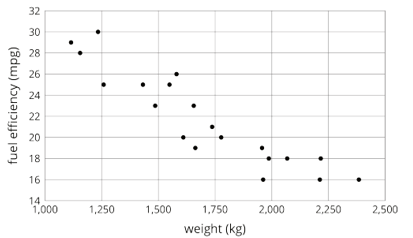 |
| two-way table | 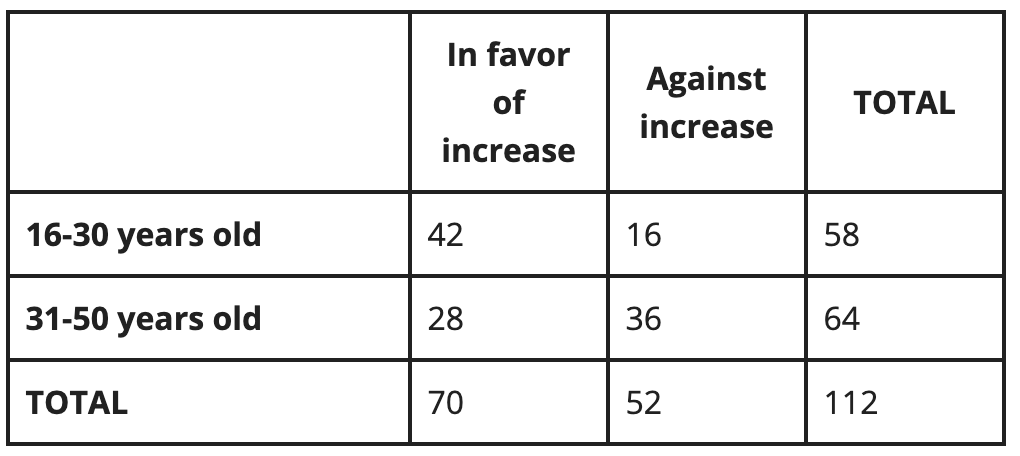 |
Essential Understandings
- Patterns of association may exist between two variables defined in bivariate data. Scatter plots and two-way tables reveal these associations and support interpretation of relationships.
- Relationships between variables in bivariate data can take several forms—positive or negative, linear or nonlinear— and in categorical data, associations are examined through relative frequencies and proportional reasoning.
- Knowing how two variables are associated allows us to make informed predictions about data beyond what is directly observed.
- For quantitative bivariate data that show a linear association, a line can be used to model the relationship and represent the trend in the data.
Materials
- Calculators (1 per student)
- Graph Paper (1 sheet per student group)
- Wikisticks or raw spaghetti (1 per student or small group)
- Computers or Tablets (1 per student group) — Any device will work that students can use to create a slide deck for presentations.
- Optional: Resource: Determining Relevance and Credibility of Sources Reference Sheet (G6–8)
- Scatter Plots
- Scatter Plot Relationships Sorting Cards (1 per group) — print single-sided
- Completing Two-Way Tables with Info Gap Cards (1 per pair of students) — print single-sided
- Teacher Guide
- Optional: Possible Climate Variables with Definitions
- Optional: Simulated Climate Data Set
To see all the materials needed for this course, view our 8th Grade Course Material Overview.
Vocabulary and Models
Unit Vocabulary
bivariate data
line fit to data (trendline)
linear/nonlinear association
positive/negative association
relative frequency
scatter plot
trend
Foundational Vocabulary
cluster
outlier
To see all the vocabulary for Unit 8, view our 8th Grade Vocabulary Glossary.
Access foundational vocabulary for Unit 8 in the same 8th Grade Vocabulary Glossary.
Lesson Map
Topic A: Associations in Bivariate Numerical Data
Topic B: Associations in Bivariate Categorical Data
Topic C: Project
Common Core Standards
Key
Major Cluster
Supporting Cluster
Additional Cluster
Core Standards
Statistics and Probability
-
8.SP.A.1 — Construct and interpret scatter plots for bivariate measurement data to investigate patterns of association between two quantities. Describe patterns such as clustering, outliers, positive or negative association, linear association, and nonlinear association.
-
8.SP.A.2 — Know that straight lines are widely used to model relationships between two quantitative variables. For scatter plots that suggest a linear association, informally fit a straight line, and informally assess the model fit by judging the closeness of the data points to the line.
-
8.SP.A.3 — Use the equation of a linear model to solve problems in the context of bivariate measurement data, interpreting the slope and intercept. For example, in a linear model for a biology experiment, interpret a slope of 1.5 cm/hr as meaning that an additional hour of sunlight each day is associated with an additional 1.5 cm in mature plant height.
-
8.SP.A.4 — Understand that patterns of association can also be seen in bivariate categorical data by displaying frequencies and relative frequencies in a two-way table. Construct and interpret a two-way table summarizing data on two categorical variables collected from the same subjects. Use relative frequencies calculated for rows or columns to describe possible association between the two variables. For example, collect data from students in your class on whether or not they have a curfew on school nights and whether or not they have assigned chores at home. Is there evidence that those who have a curfew also tend to have chores?
Foundational Standards
Expressions and Equations
-
8.EE.B.5
Functions
-
8.F.A.3
-
8.F.B.4
-
8.F.B.5
Ratios and Proportional Relationships
-
6.RP.A.3.C
-
7.RP.A.3
Statistics and Probability
-
6.SP.A.2
-
6.SP.B.4
-
7.SP.A.1
-
7.SP.A.2
-
7.SP.B.4
-
7.SP.C.5
Future Standards
High School — Statistics and Probability
-
S.ID.B.5
-
S.ID.B.6
-
S.ID.C.7
-
S.ID.C.8
-
S.ID.C.9
Standards for Mathematical Practice
-
CCSS.MATH.PRACTICE.MP1 — Make sense of problems and persevere in solving them.
-
CCSS.MATH.PRACTICE.MP2 — Reason abstractly and quantitatively.
-
CCSS.MATH.PRACTICE.MP3 — Construct viable arguments and critique the reasoning of others.
-
CCSS.MATH.PRACTICE.MP4 — Model with mathematics.
-
CCSS.MATH.PRACTICE.MP5 — Use appropriate tools strategically.
-
CCSS.MATH.PRACTICE.MP6 — Attend to precision.
-
CCSS.MATH.PRACTICE.MP7 — Look for and make use of structure.
-
CCSS.MATH.PRACTICE.MP8 — Look for and express regularity in repeated reasoning.
